Support
Top questions about Synnefa
Need something cleared up? Here are our most frequently asked questions
General FAQs
Everything you need to know about Synnefa and our products. Can’t find an answer Please chat with our Friendly team
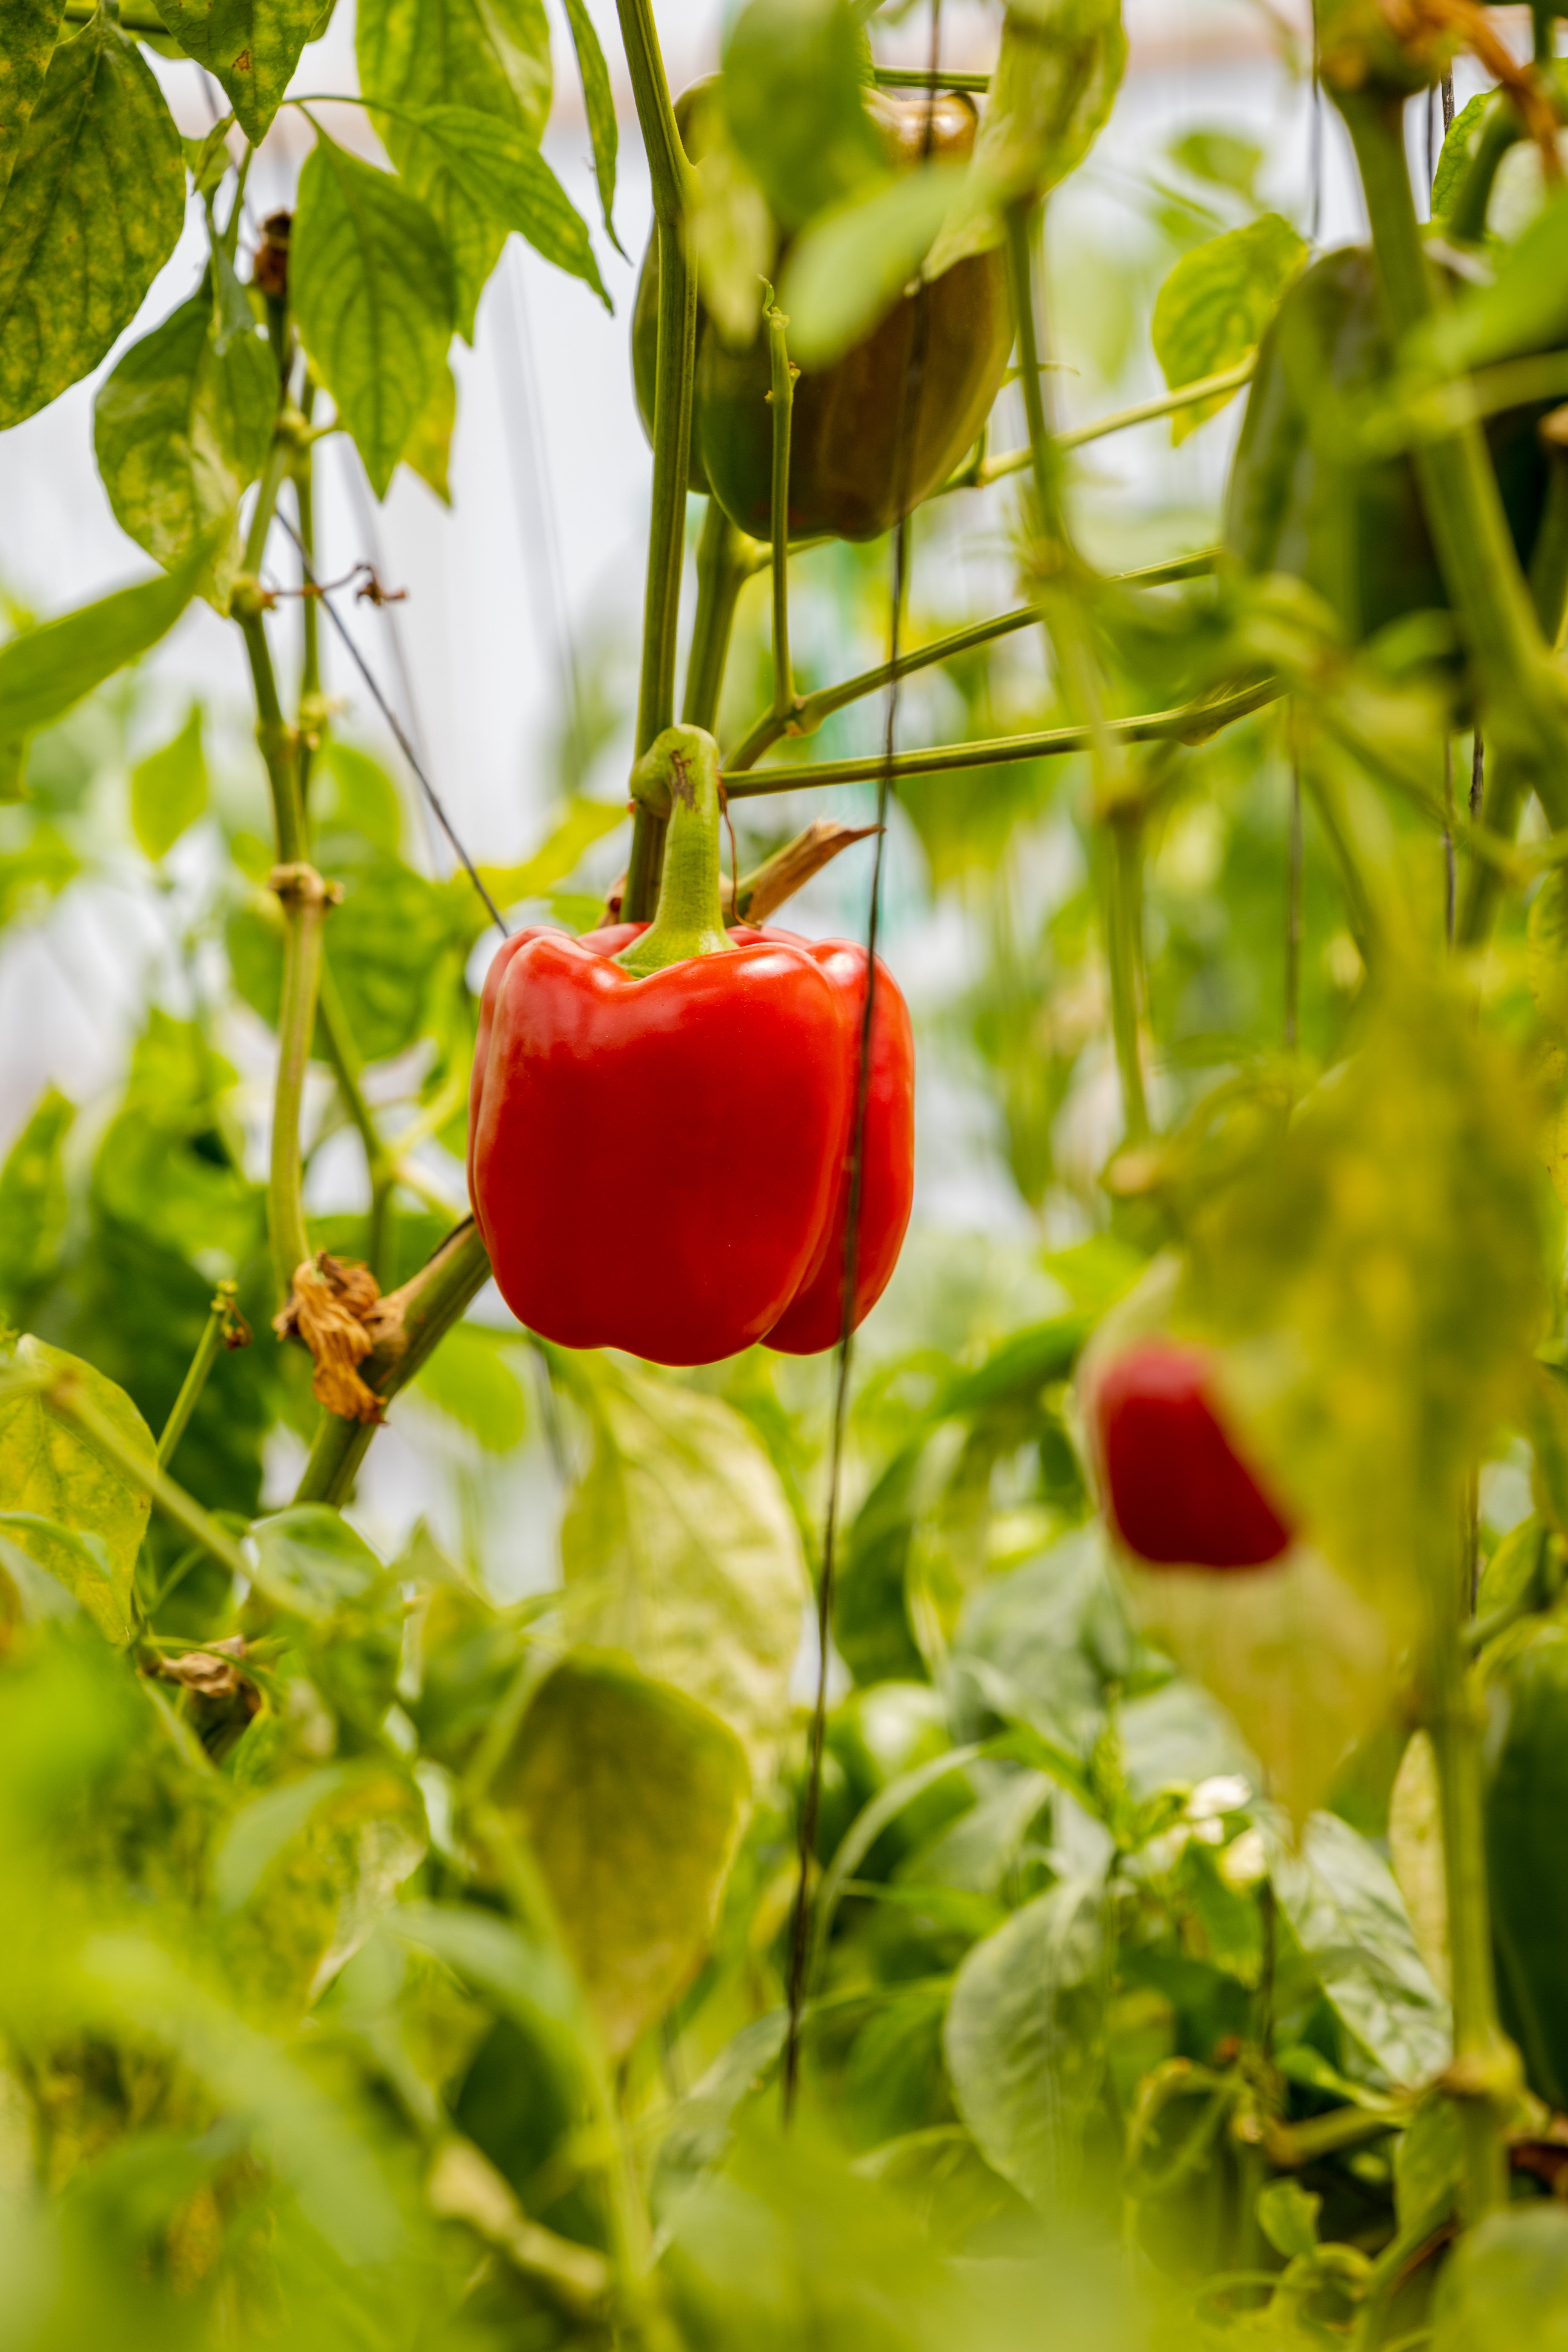
Capsicum approximately takes 45days- 90 days from Nursery to harvest
You can visit this link to get more information on the specific number of days capsicum takes per stage. Capsicum growing
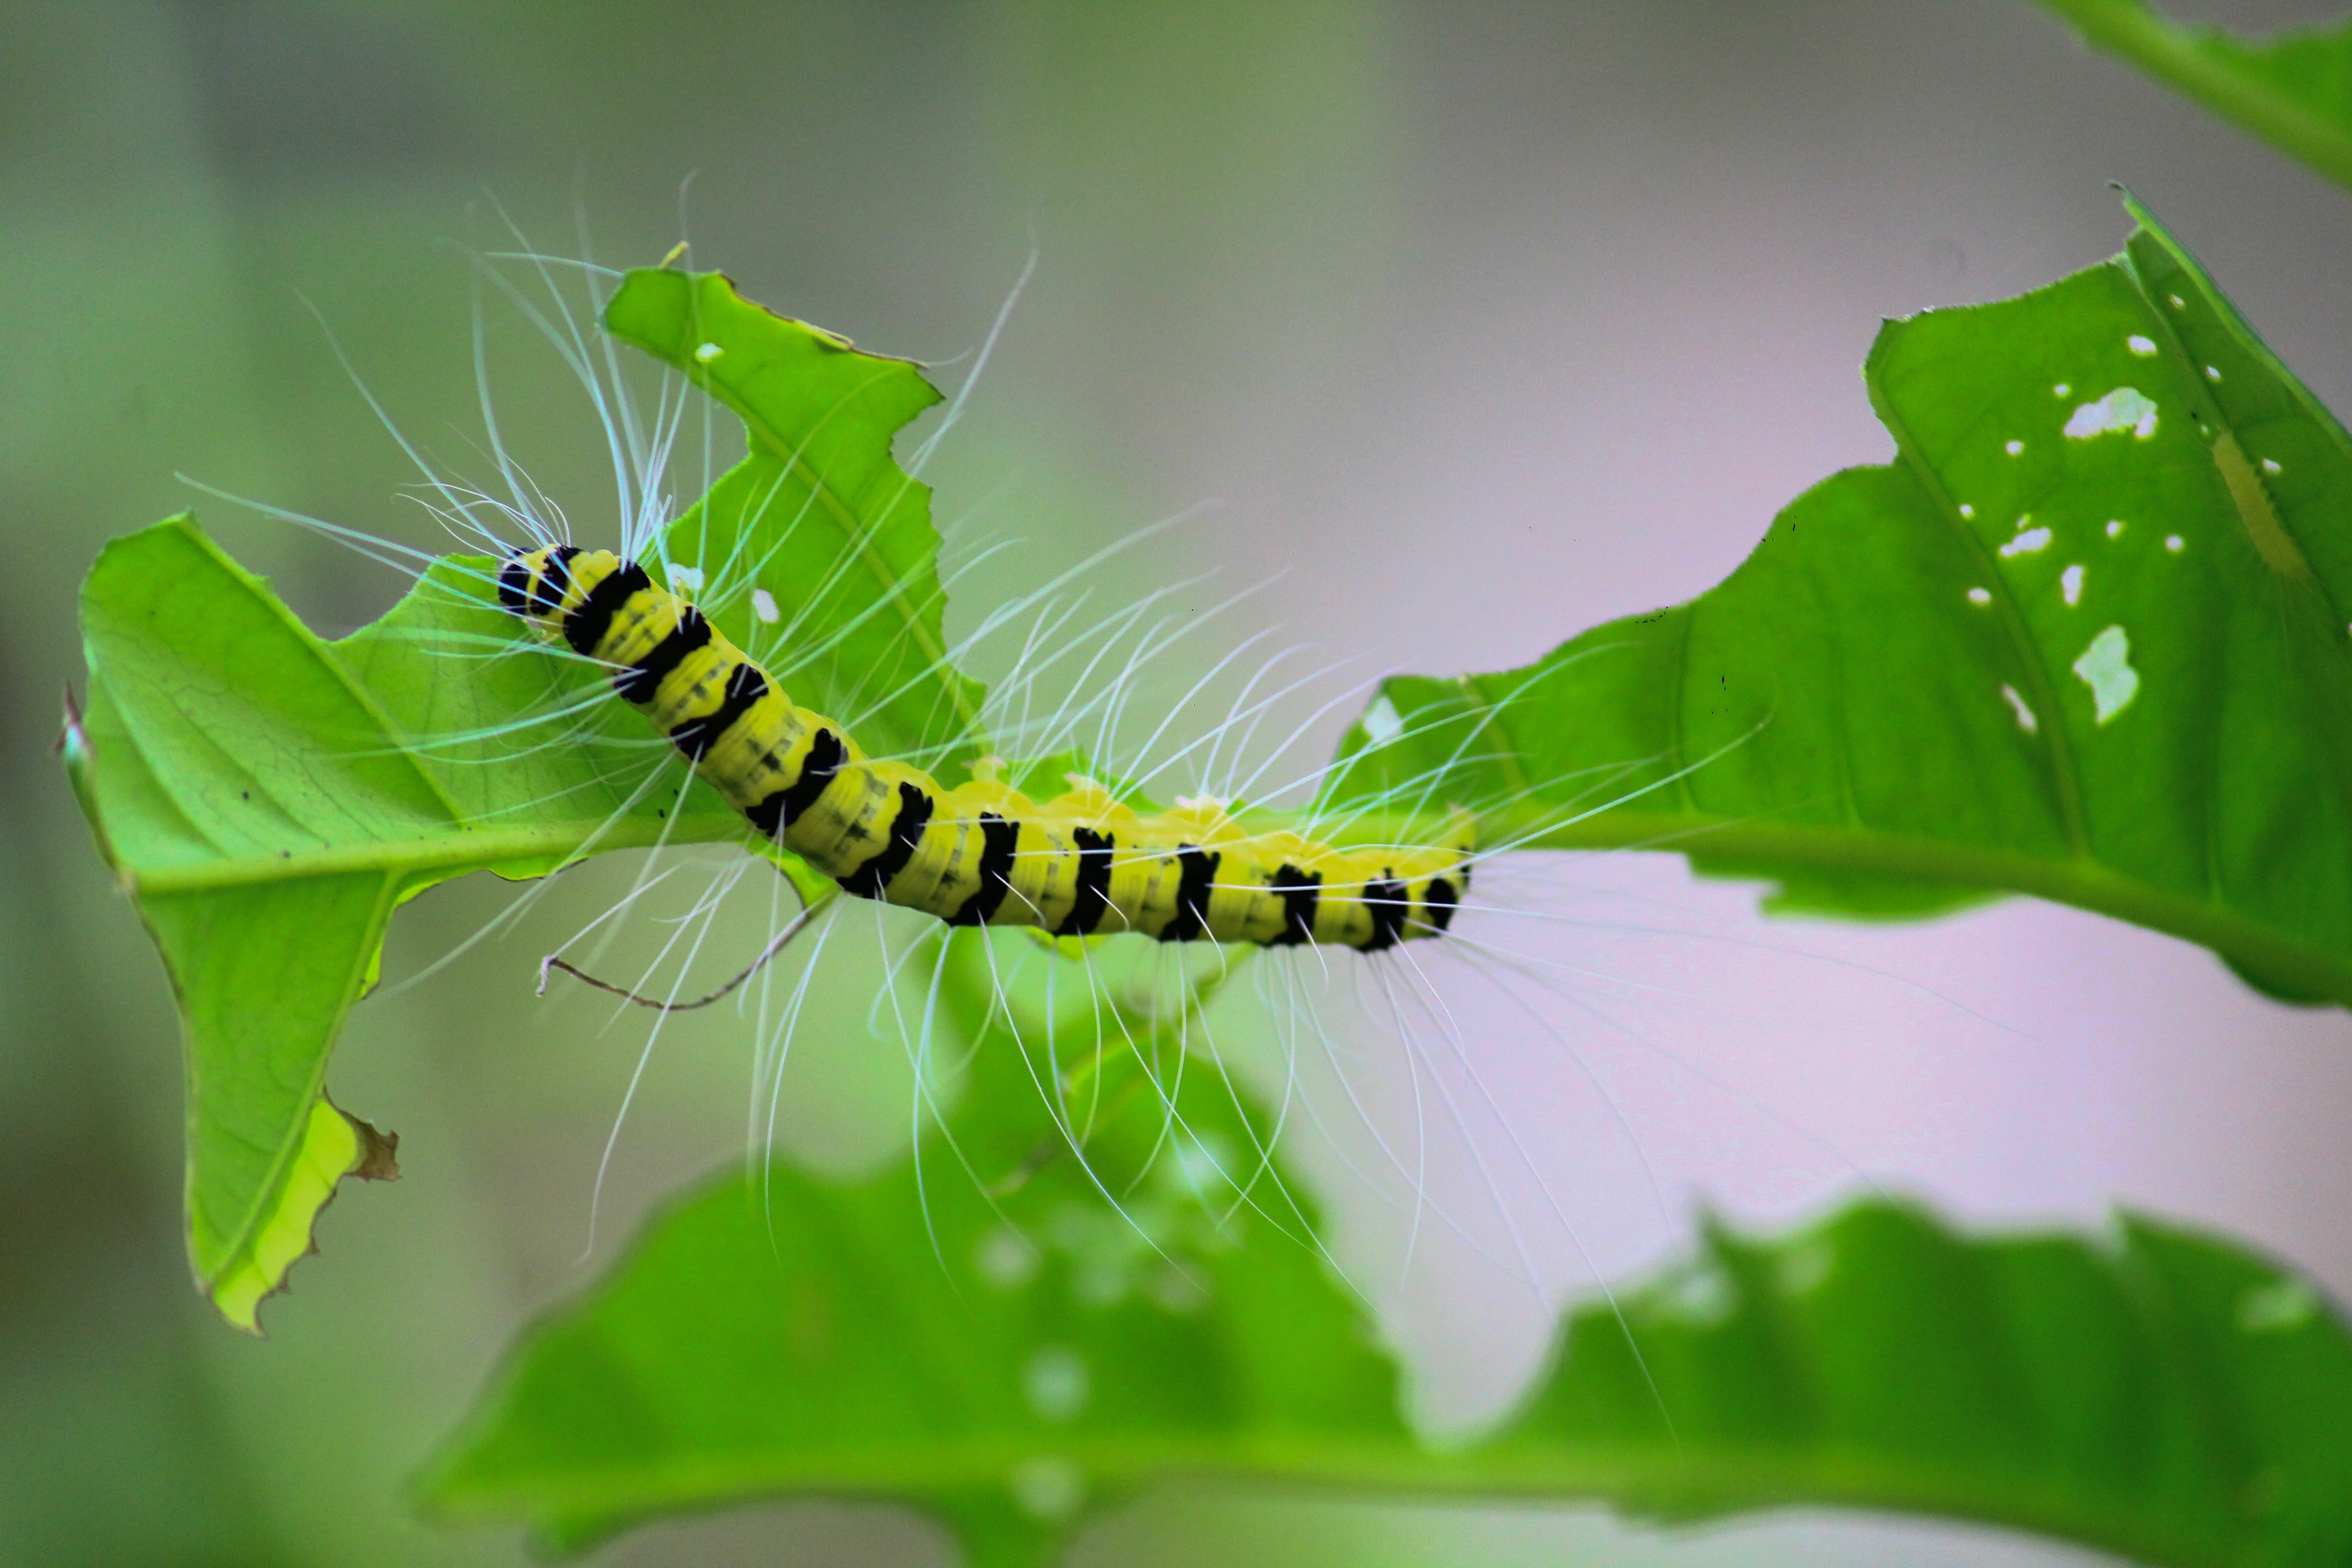
The pests include:
- Tuta absoluta.
- Whiteflies.
- Cutworms.
- Thrips.
- Leafminer.
Capsicum typically matures in 6-8 months and is harvested twice weekly. This ensures freshness and optimum flavor.
Discover the joy of cultivating your own Capsicum and Tomato plants. Armed with our insightful guide, even beginners can yield a successful harvest. Understand the basics of choosing the right seeds, optimizing soil conditions, and managing sunlight exposure. Learn how to fend off pests and diseases while ensuring optimal growth. In a short time, you'll watch your Capsicum and Tomatoes flourish, reaping the rewards of your gardening efforts. Start your journey today with our easy-to-follow, effective techniques by clicking on this Link
Any area but close to source of product to be dried.
FarmCloud FAQs
Everything you need to know about FarmCloud, Synnefa's Farm management, data collection and analysis platform. Can’t find an answer? Please chat with our Friendly team
Prepared by: Catherine Gathoni
Introduction
This help section aims to provide an in-depth explanation of the different vegetation indices accessible via the FarmCloud platform, specifically under the Weather and Satellite section. To enhance understanding, reference images have been included. This guide is designed to help you grasp the importance of these indices and how to use them effectively for decision-making on your farm. Should you have any questions, feel free to ask for further clarification.
Overview of FarmCloud’s Weather and Satellite Features
The weather and satellite feature in FarmCloud is designed to give farmers access to real-time and historical data about their land and crops. This includes weather forecasts, precipitation levels, temperature variations, and satellite imagery of their farms. With this data, farmers can make better decisions regarding when to plant, irrigate, and harvest, as well as identify potential issues early, such as droughts, poor soil moisture, or disease outbreaks. Essentially, it provides a comprehensive view of the farm's health and productivity, allowing farmers to react quickly and improve farm management efficiency.
Purpose of the Weather and Satellite Feature
The core purpose of the weather and satellite feature on FarmCloud is to deliver timely and accurate data that helps farmers monitor their farms remotely, make informed decisions, and take preventive actions to minimize risks. By using this tool, farmers can optimize resource usage, enhance crop yields, and reduce potential losses from extreme weather or poor soil conditions. It empowers farmers with actionable insights that lead to improved productivity and reduced costs through effective farm management.
Importance of Weather and Satellite Data
The integration of weather and satellite features in farm management dashboards is critical for several reasons, particularly in industries like agriculture, logistics, and disaster preparedness:
- Remote Monitoring: Satellite data allows farmers to monitor large tracts of land without needing to be physically present. It provides essential insights on land use, crop health (via vegetation indices like NDVI), and other key metrics.
- Risk Mitigation: Up-to-date weather forecasts enable users to anticipate and prepare for adverse weather conditions, such as storms, droughts, or floods, thus reducing potential crop and financial losses.
- Informed Decision-Making: Real-time weather data and satellite imagery provide vital information to help farmers plan essential activities such as irrigation, planting, and harvesting with greater precision.
- Resource Optimization: Understanding weather patterns enables farmers to manage resources more efficiently, like reducing water usage during rainfall or adjusting the timing of crop protection applications.
- Data-Driven Insights: The combination of weather and satellite information offers actionable insights that help optimize productivity, reduce input costs, and improve overall outcomes based on current and forecasted environmental conditions.
Challenges and Disadvantages of Weather and Satellite Feature
While weather and satellite data offer significant benefits, there are some challenges associated with using these features:
- Data Overload: Large amounts of data can overwhelm users, making it difficult to interpret without adequate training or tools.
- Limited Accuracy: Weather forecasts, although advanced, are not always completely accurate, and sudden changes in weather patterns may lead to incorrect decisions.
- Dependency on Technology: Over-reliance on satellite and weather data can result in operational issues if technology fails or data is temporarily unavailable.
- Cloud Coverage and Resolution Limitations: Satellite imagery can be obscured by cloud cover, and lower resolution in real-time images can affect the accuracy of observations.
Steps for Using the Weather and Satellite Feature
Before utilizing the weather and satellite features on FarmCloud, users must first define the farm boundary.
Farm Boundary Setup
A farm boundary is essentially a line that defines the edges of your farm, separating it from surrounding areas. Drawing this boundary is the first step in setting up the system, as it helps FarmCloud accurately track weather and satellite data for the specified land area.
Weather and Satellite Explained
Weather:
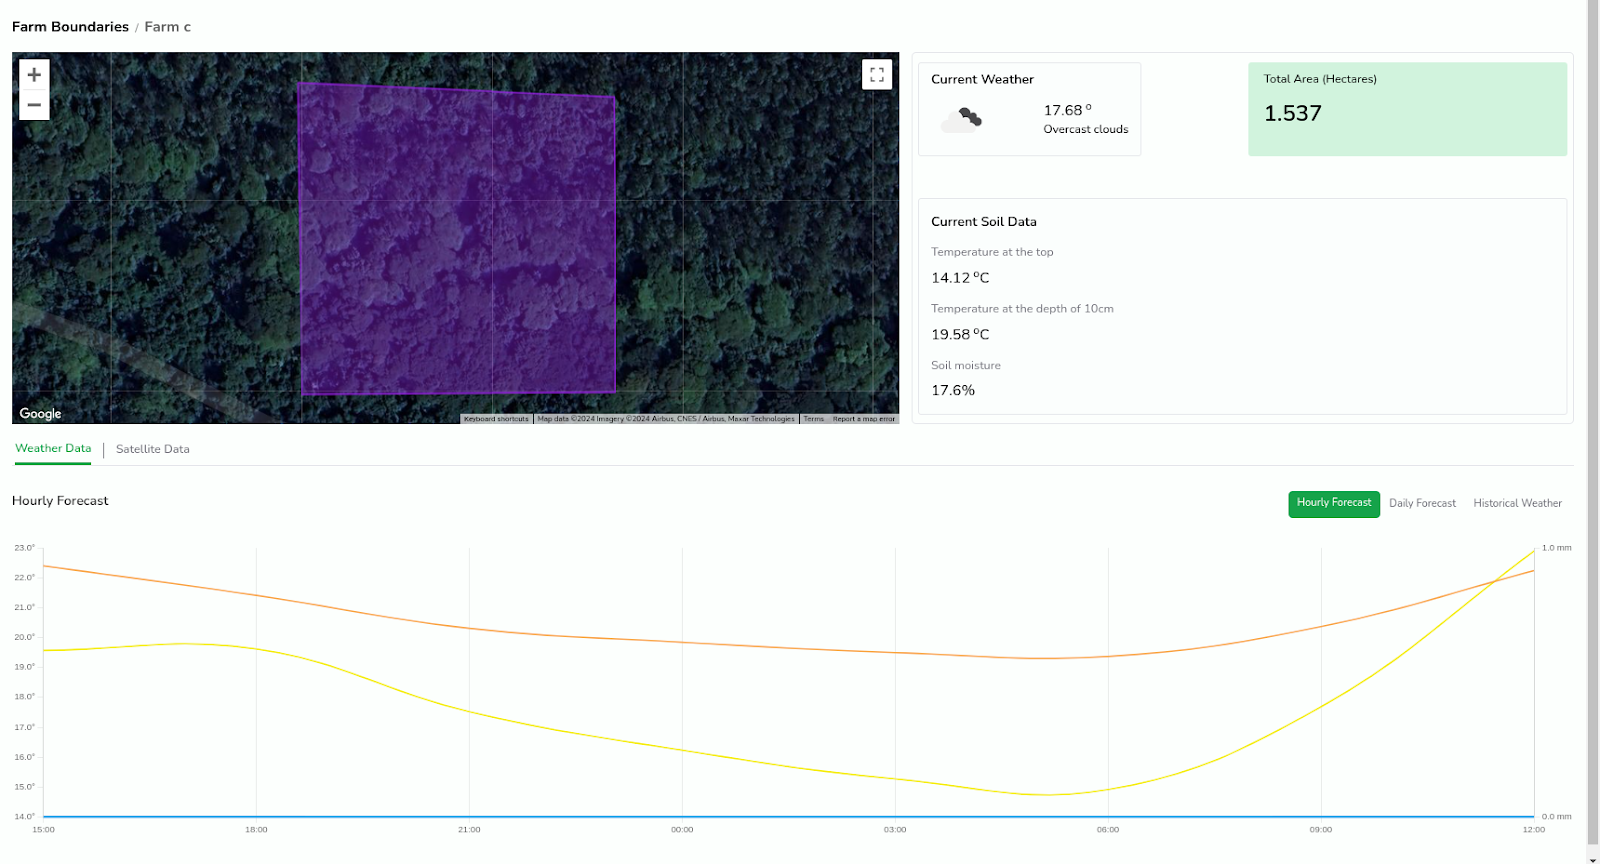
Weather refers to the current atmospheric conditions around us, including elements like temperature, humidity, wind, rain, or sunshine. On FarmCloud, users can view weather forecasts in hourly, daily, or historical formats, which helps in planning and risk management for farm activities.
Satellite:
Satellites are man-made objects placed in orbit around the Earth to collect images and data about the planet. On FarmCloud, satellite data is used to provide real-time insights into land use, crop health, and environmental conditions. This data is crucial for weather forecasting, monitoring crop health, and mapping land features.
With FarmCloud, users can view past data for both weather and satellite imagery, as well as access different vegetation indices like NDVI and DSWI. Let’s explore each of these indices in detail.
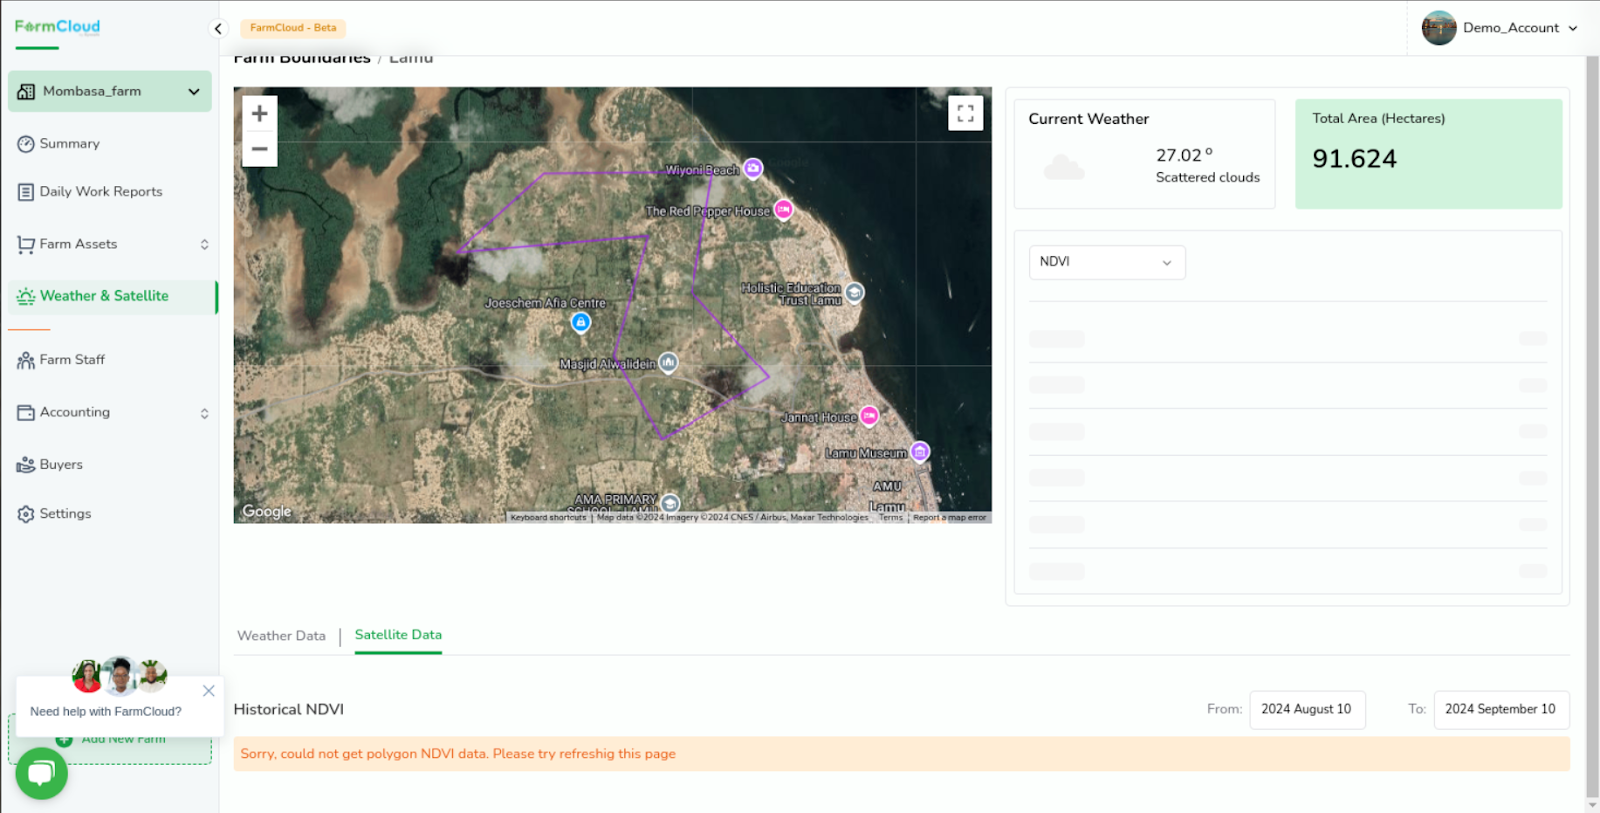
Sometimes, the data might not be retrieved as shown below
Vegetation Indices and Their Purpose
What are Vegetation Indices?
Vegetation indices are numerical values or scores used to assess the health and "greenness" of plants in a given area. These indices help farmers understand crop health, water stress, and overall vegetation performance. FarmCloud provides several key indices:
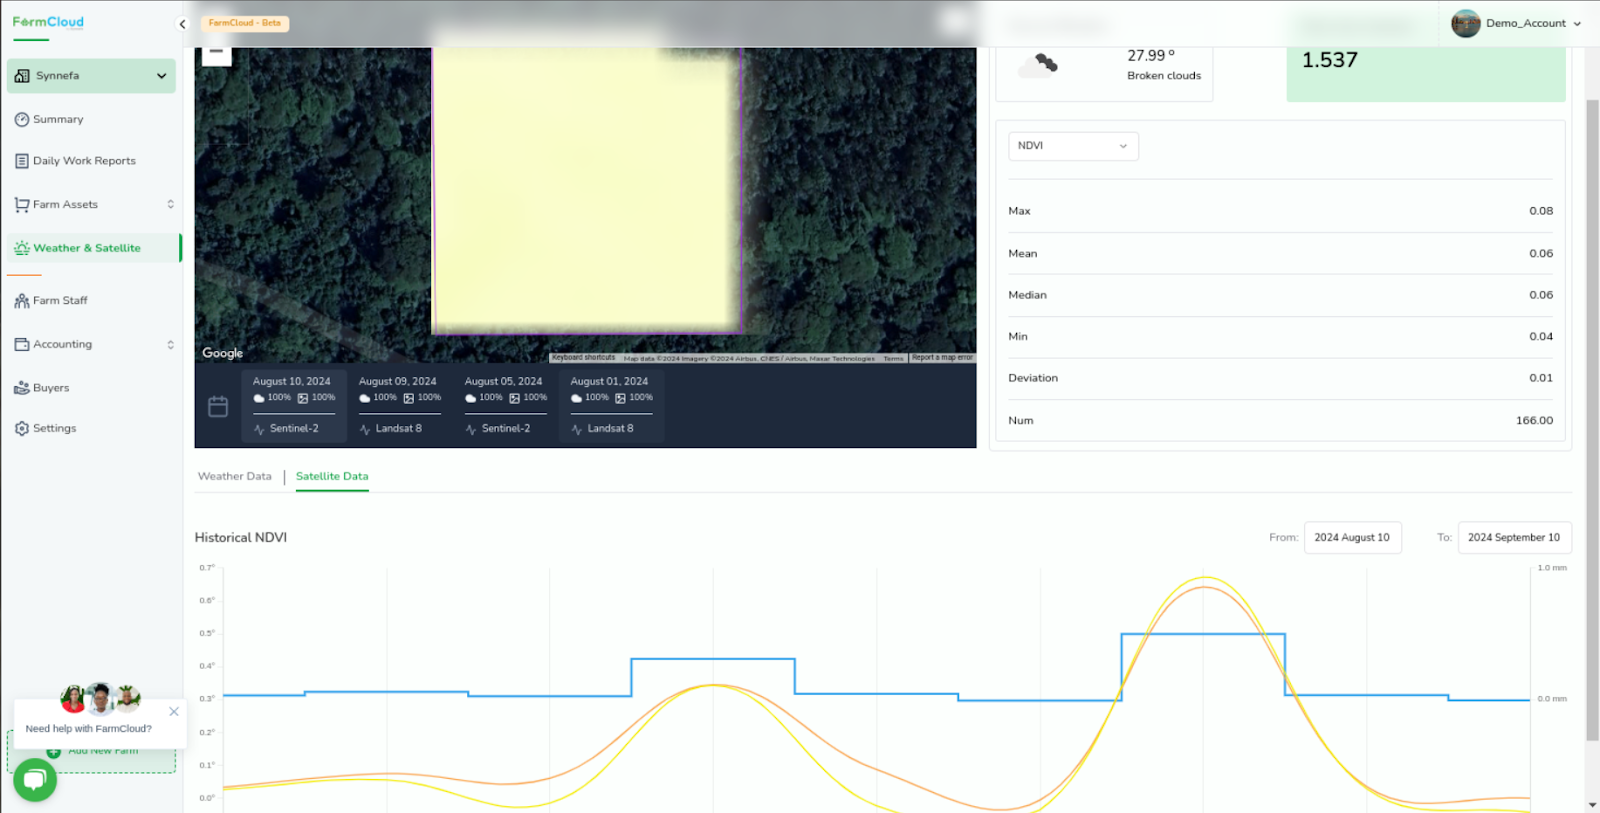
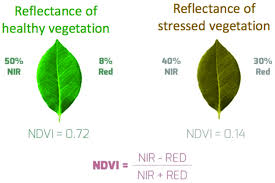
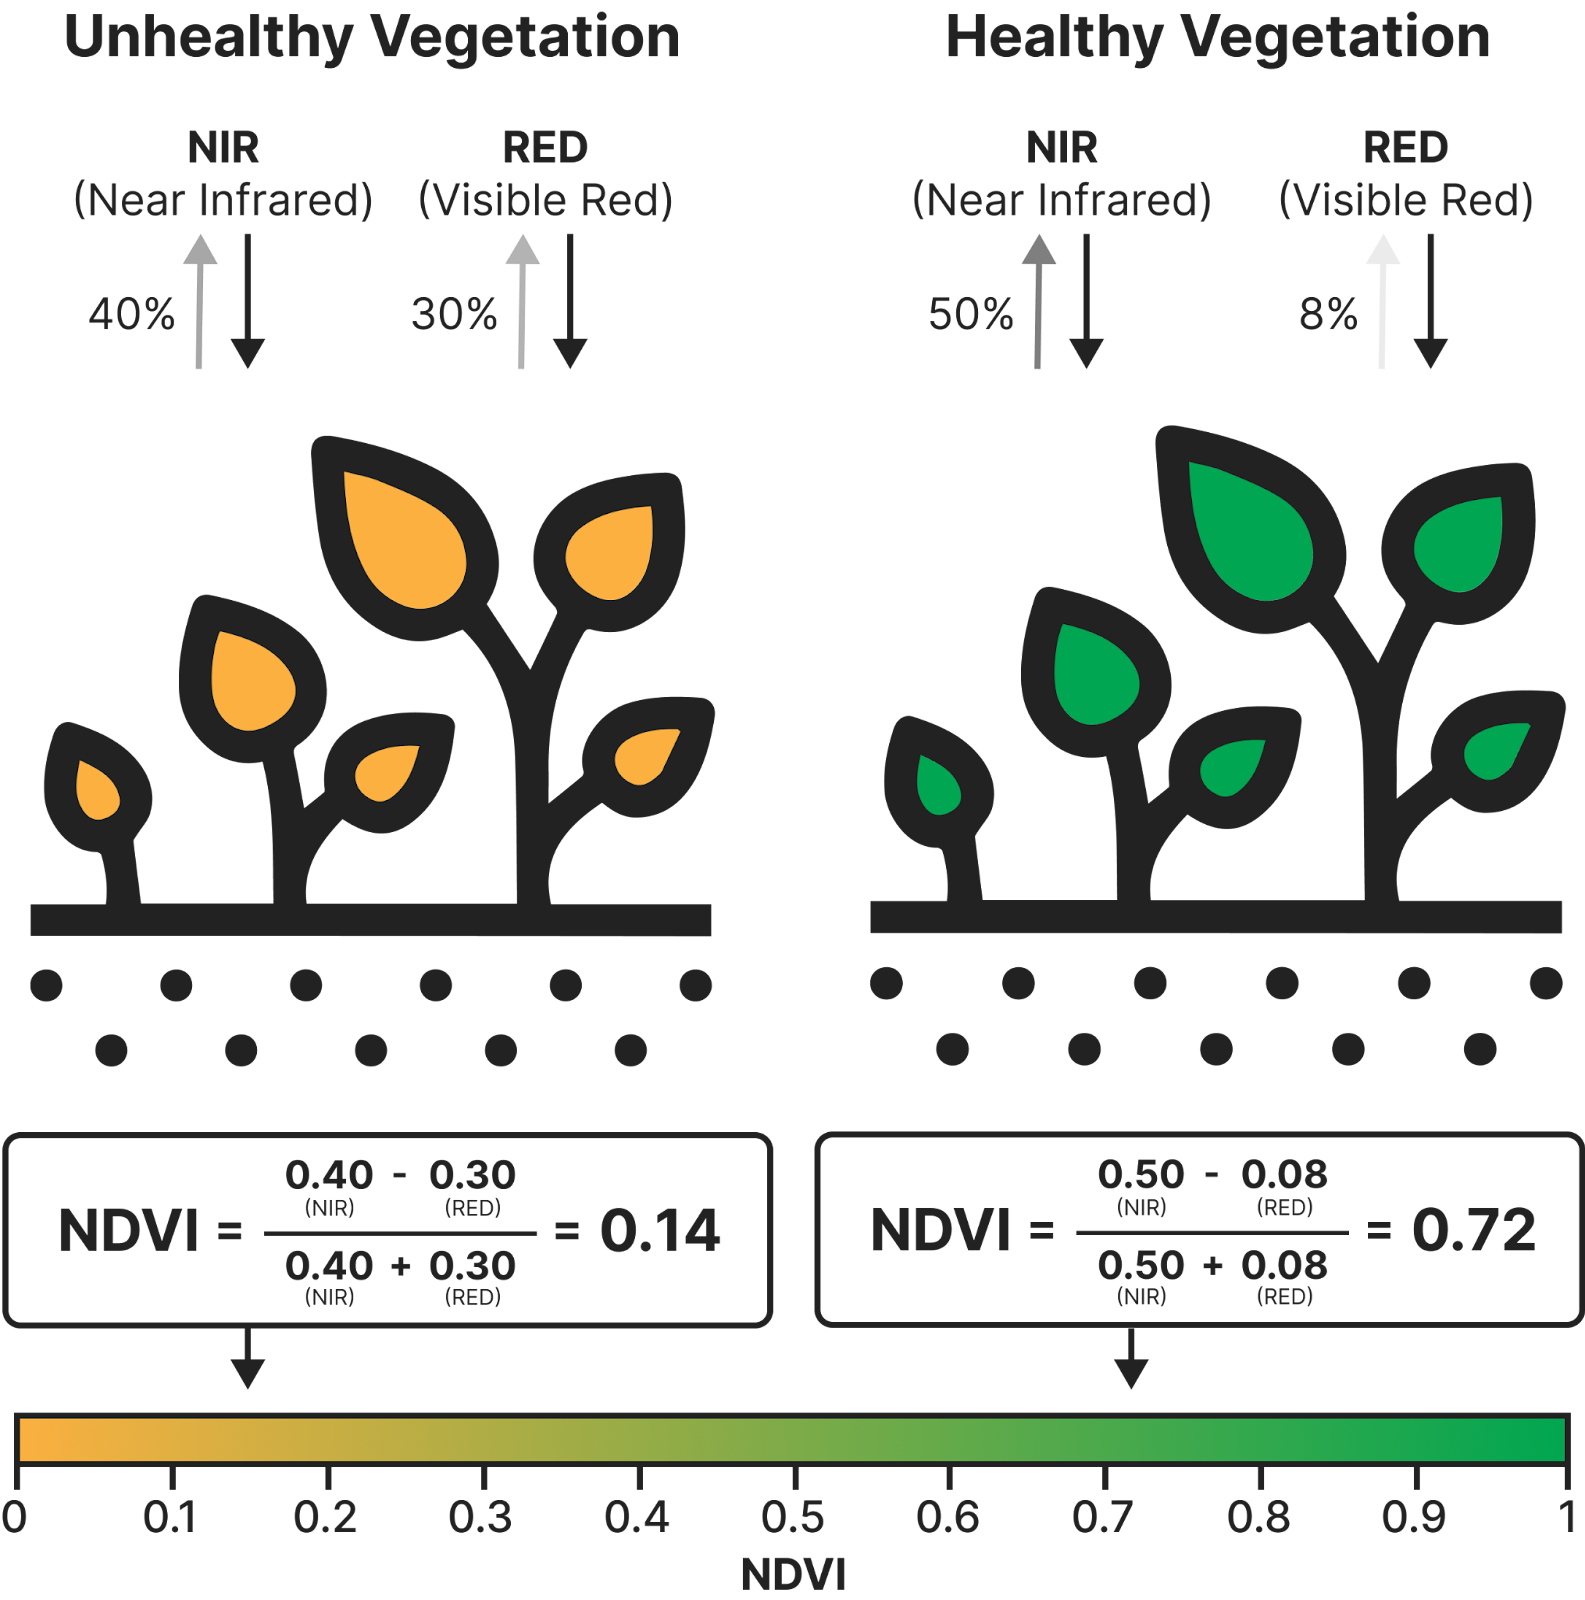
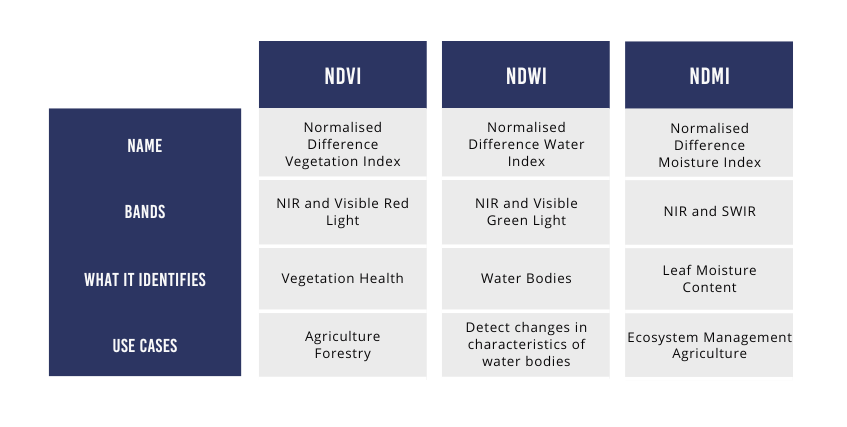
- NDVI (Normalized Difference Vegetation Index): NDVI measures the amount of green vegetation in an area. It works by analyzing how plants reflect visible and near-infrared light, giving insights into plant health. Higher NDVI values indicate healthier, greener crops, while lower values suggest stressed or sparse vegetation.
- NRI (Normalized Ratio Index): NRI evaluates plant health by comparing how much light plants reflect in different wavelengths, particularly red and near-infrared light. This ratio gives an accurate picture of plant health and helps monitor crop growth.
- EVI (Enhanced Vegetation Index): EVI is similar to NDVI but is better suited for areas with dense vegetation. It adjusts for atmospheric interference, making it more reliable in heavily vegetated regions.
- EVI2 (Enhanced Vegetation Index 2): EVI2 is a simplified version of EVI, ideal for areas where satellite data is less comprehensive. It’s more accurate in tough environments like deserts or areas with bright ground surfaces.
- NDWI (Normalized Difference Water Index): NDWI measures the water content in plants and soil. It is particularly useful for monitoring drought conditions, crop water stress, and water resource availability.
- DSWI (Dry Soil Water Index): DSWI measures soil moisture levels by analyzing how light reflects off the soil surface. This index helps detect drought or water stress, giving farmers early warning signals to adjust irrigation.
How to Interpret Vegetation Indices
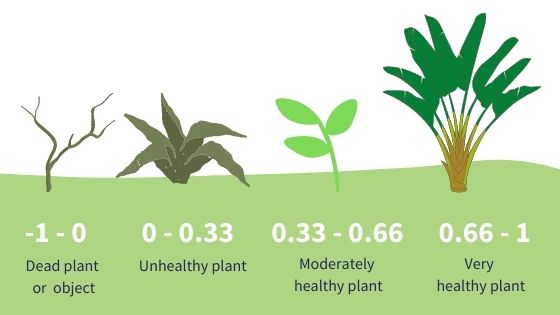
NDVI (Normalized Difference Vegetation Index):
- What it tells you: NDVI indicates how green and healthy the vegetation in an area is.
- How to read it:
- Closer to +1: Healthy, dense vegetation.
- Around 0: Bare soil or areas with little vegetation.
- Below 0: Water, snow, or non-vegetated surfaces like rocks.
EVI (Enhanced Vegetation Index):
- What it tells you: EVI works better in areas with dense vegetation, helping reduce atmospheric "noise" such as haze or clouds. It’s especially useful in thickly forested areas.
- How to read it: Higher EVI values indicate healthier, more productive plants.
EVI2:
- What it tells you: A simplified version of EVI, providing reliable vegetation data when satellite inputs are limited.
- How to read it: Interpreted similarly to EVI—higher values reflect healthier crops.
DWSI (Drought Water Stress Index):
- What it tells you: DWSI highlights areas where vegetation is stressed due to a lack of water.
- How to read it: Higher values mean more drought stress, while lower values indicate sufficient water for the plants.
NDWI (Normalized Difference Water Index):
Examples of Practical Use: A brief case study or real-world example of how a farmer could use the weather and satellite data to make a specific decision (e.g., "A farmer can be able to save water by using NDWI to detect sufficient soil moisture after a rainy week").
- What it tells you: NDWI measures water content in plants and the soil.
- How to read it: Higher values suggest more water content in the plants, while lower values indicate dry conditions.
Graph Interpretation for Temperature and Precipitation
Understanding the Axes:
- X-axis (Horizontal): Represents time (e.g., hours, days, or weeks).
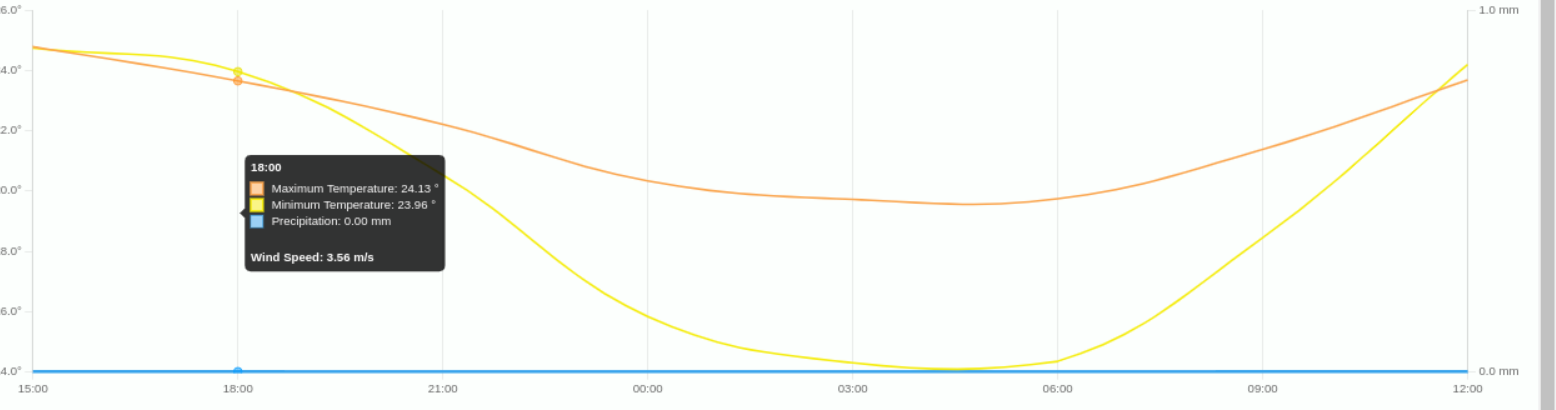
- Y-axis 1 (Vertical): Represents temperature (°C).
- Y-axis 2 (Opposite Vertical): Represents precipitation (mm).
Temperature Curve:
- Rising or falling temperature trends show daily or longer-term weather patterns, such as daytime heat or the arrival of a cold front.
Precipitation Bars:
- Precipitation is represented as bars, where taller bars show significant rainfall and shorter or no bars represent dry periods.
Combined Interpretation:
- Temperature drops followed by precipitation can indicate stormy weather, while high temperatures with no rainfall suggest drought conditions.
Frequently Asked Questions (FAQs)
- What does NDVI tell me? NDVI helps you understand how green and healthy your plants are. Higher values indicate healthy crops, while lower values may signal poor growth or lack of vegetation.
- Why is my satellite data not showing accurate results? Satellite data may be inaccurate due to factors like cloud cover, low image resolution, or delays in data updates. Additionally, smaller farm areas may result in less specific data.
- How do I know if my crops are under water stress? You can assess water stress using indices like NDWI or DWSI. Low values in these indices indicate that your crops may need more water or are facing drought conditions.
- Why can’t I see data for my farm from other countries? Satellite and weather data are usually specific to a region. FarmCloud focuses on your farm’s location to provide the most accurate data. Data from other countries is not available because weather patterns and soil conditions differ significantly
1. Click on the Menu, then proceed down, and then click on "Weather & Satellite"
2. You will be redirected to another page with a Google Map at the top, beneath that you will view the list of Farm Boundaries created
3. On that specific row with the Farm boundary proceed to the right side just after "Date created" You will see 3 dots on the last column.
4. Click on the 3 dots on the right-hand side of the plant you have added. This opens the Step level where you choose " Delete" or "Edit " where needed.
*In case you click edit you will only be able to edit the name of the Farm Boundary.
*Still not sure? Here's a quick video on how to go about it!
Kindly follow the following steps;
1. You click on your Menu, then proceed to the "Expenses" section and click on it.
2. At the top you select either "General Expenses" or "Element Specific Expenses"
3. Then proceed to the right-hand side on the green button and Click "Add Expenses"
4. Once you have added the expenses move your cursor to the right-hand side under status then click "Approved or Reject Expense " where necessary.
- Here is a guide:

Follow the following steps:
1. Click on the menu
2. Go to the "My products" section and click on "Fertilizer and Agrochemicals"
Select the "Fertilizer" section
- Then click on the "Add Fertilizer" button
- Then populate the details as required they include: "Fertilizer name, Supplier, Quantity, Min Quantity Alert, Total Cost, and Application Method."
- Lastly, click the "Add" button.
(Kindly note if you're adding a fertilizer and it doesn't display from the list contact admin)
*Still not sure? Here's a quick video on how to go about it!
1. Crop health monitoring:
Satellite imagery provides a bird's-eye view of your entire farm, allowing you to spot variations in crop health that might not be visible from the ground.
2. Precision agriculture:
By analyzing satellite data, you can create precise maps of your fields showing variations in soil type, moisture levels, and crop performance.
3. Yield prediction:
Satellite-derived vegetation indices, such as NDVI (Normalized Difference Vegetation Index), correlate strongly with crop biomass and potential yield.
4. Water management:
Satellites can detect soil moisture levels and crop water stress across your entire farm. This information helps optimize irrigation schedules, ensuring water is applied where and when it's most needed
FarmShield™ FAQs
Everything you need to know about FarmShield™, Synnefa's farm automation system. Can’t find an answer? Please chat with our Friendly team
Prepared by: Catherine Gathoni
Introduction
This help section aims to provide an in-depth explanation of the different vegetation indices accessible via the FarmCloud platform, specifically under the Weather and Satellite section. To enhance understanding, reference images have been included. This guide is designed to help you grasp the importance of these indices and how to use them effectively for decision-making on your farm. Should you have any questions, feel free to ask for further clarification.
Overview of FarmCloud’s Weather and Satellite Features
The weather and satellite feature in FarmCloud is designed to give farmers access to real-time and historical data about their land and crops. This includes weather forecasts, precipitation levels, temperature variations, and satellite imagery of their farms. With this data, farmers can make better decisions regarding when to plant, irrigate, and harvest, as well as identify potential issues early, such as droughts, poor soil moisture, or disease outbreaks. Essentially, it provides a comprehensive view of the farm's health and productivity, allowing farmers to react quickly and improve farm management efficiency.
Purpose of the Weather and Satellite Feature
The core purpose of the weather and satellite feature on FarmCloud is to deliver timely and accurate data that helps farmers monitor their farms remotely, make informed decisions, and take preventive actions to minimize risks. By using this tool, farmers can optimize resource usage, enhance crop yields, and reduce potential losses from extreme weather or poor soil conditions. It empowers farmers with actionable insights that lead to improved productivity and reduced costs through effective farm management.
Importance of Weather and Satellite Data
The integration of weather and satellite features in farm management dashboards is critical for several reasons, particularly in industries like agriculture, logistics, and disaster preparedness:
- Remote Monitoring: Satellite data allows farmers to monitor large tracts of land without needing to be physically present. It provides essential insights on land use, crop health (via vegetation indices like NDVI), and other key metrics.
- Risk Mitigation: Up-to-date weather forecasts enable users to anticipate and prepare for adverse weather conditions, such as storms, droughts, or floods, thus reducing potential crop and financial losses.
- Informed Decision-Making: Real-time weather data and satellite imagery provide vital information to help farmers plan essential activities such as irrigation, planting, and harvesting with greater precision.
- Resource Optimization: Understanding weather patterns enables farmers to manage resources more efficiently, like reducing water usage during rainfall or adjusting the timing of crop protection applications.
- Data-Driven Insights: The combination of weather and satellite information offers actionable insights that help optimize productivity, reduce input costs, and improve overall outcomes based on current and forecasted environmental conditions.
Challenges and Disadvantages of Weather and Satellite Feature
While weather and satellite data offer significant benefits, there are some challenges associated with using these features:
- Data Overload: Large amounts of data can overwhelm users, making it difficult to interpret without adequate training or tools.
- Limited Accuracy: Weather forecasts, although advanced, are not always completely accurate, and sudden changes in weather patterns may lead to incorrect decisions.
- Dependency on Technology: Over-reliance on satellite and weather data can result in operational issues if technology fails or data is temporarily unavailable.
- Cloud Coverage and Resolution Limitations: Satellite imagery can be obscured by cloud cover, and lower resolution in real-time images can affect the accuracy of observations.
Steps for Using the Weather and Satellite Feature
Before utilizing the weather and satellite features on FarmCloud, users must first define the farm boundary.
Farm Boundary Setup
A farm boundary is essentially a line that defines the edges of your farm, separating it from surrounding areas. Drawing this boundary is the first step in setting up the system, as it helps FarmCloud accurately track weather and satellite data for the specified land area.
Weather and Satellite Explained
Weather:
Weather refers to the current atmospheric conditions around us, including elements like temperature, humidity, wind, rain, or sunshine. On FarmCloud, users can view weather forecasts in hourly, daily, or historical formats, which helps in planning and risk management for farm activities.
Satellite:
Satellites are man-made objects placed in orbit around the Earth to collect images and data about the planet. On FarmCloud, satellite data is used to provide real-time insights into land use, crop health, and environmental conditions. This data is crucial for weather forecasting, monitoring crop health, and mapping land features.
With FarmCloud, users can view past data for both weather and satellite imagery, as well as access different vegetation indices like NDVI and DSWI. Let’s explore each of these indices in detail.
Sometimes, the data might not be retrieved as shown below
Vegetation Indices and Their Purpose
What are Vegetation Indices?
Vegetation indices are numerical values or scores used to assess the health and "greenness" of plants in a given area. These indices help farmers understand crop health, water stress, and overall vegetation performance. FarmCloud provides several key indices:
- NDVI (Normalized Difference Vegetation Index): NDVI measures the amount of green vegetation in an area. It works by analyzing how plants reflect visible and near-infrared light, giving insights into plant health. Higher NDVI values indicate healthier, greener crops, while lower values suggest stressed or sparse vegetation.
- NRI (Normalized Ratio Index): NRI evaluates plant health by comparing how much light plants reflect in different wavelengths, particularly red and near-infrared light. This ratio gives an accurate picture of plant health and helps monitor crop growth.
- EVI (Enhanced Vegetation Index): EVI is similar to NDVI but is better suited for areas with dense vegetation. It adjusts for atmospheric interference, making it more reliable in heavily vegetated regions.
- EVI2 (Enhanced Vegetation Index 2): EVI2 is a simplified version of EVI, ideal for areas where satellite data is less comprehensive. It’s more accurate in tough environments like deserts or areas with bright ground surfaces.
- NDWI (Normalized Difference Water Index): NDWI measures the water content in plants and soil. It is particularly useful for monitoring drought conditions, crop water stress, and water resource availability.
- DSWI (Dry Soil Water Index): DSWI measures soil moisture levels by analyzing how light reflects off the soil surface. This index helps detect drought or water stress, giving farmers early warning signals to adjust irrigation.
How to Interpret Vegetation Indices
NDVI (Normalized Difference Vegetation Index):
- What it tells you: NDVI indicates how green and healthy the vegetation in an area is.
- How to read it:
- Closer to +1: Healthy, dense vegetation.
- Around 0: Bare soil or areas with little vegetation.
- Below 0: Water, snow, or non-vegetated surfaces like rocks.
EVI (Enhanced Vegetation Index):
- What it tells you: EVI works better in areas with dense vegetation, helping reduce atmospheric "noise" such as haze or clouds. It’s especially useful in thickly forested areas.
- How to read it: Higher EVI values indicate healthier, more productive plants.
EVI2:
- What it tells you: A simplified version of EVI, providing reliable vegetation data when satellite inputs are limited.
- How to read it: Interpreted similarly to EVI—higher values reflect healthier crops.
DWSI (Drought Water Stress Index):
- What it tells you: DWSI highlights areas where vegetation is stressed due to a lack of water.
- How to read it: Higher values mean more drought stress, while lower values indicate sufficient water for the plants.
NDWI (Normalized Difference Water Index):
Examples of Practical Use: A brief case study or real-world example of how a farmer could use the weather and satellite data to make a specific decision (e.g., "A farmer can be able to save water by using NDWI to detect sufficient soil moisture after a rainy week").
- What it tells you: NDWI measures water content in plants and the soil.
- How to read it: Higher values suggest more water content in the plants, while lower values indicate dry conditions.
Graph Interpretation for Temperature and Precipitation
Understanding the Axes:
- X-axis (Horizontal): Represents time (e.g., hours, days, or weeks).
- Y-axis 1 (Vertical): Represents temperature (°C).
- Y-axis 2 (Opposite Vertical): Represents precipitation (mm).
Temperature Curve:
- Rising or falling temperature trends show daily or longer-term weather patterns, such as daytime heat or the arrival of a cold front.
Precipitation Bars:
- Precipitation is represented as bars, where taller bars show significant rainfall and shorter or no bars represent dry periods.
Combined Interpretation:
- Temperature drops followed by precipitation can indicate stormy weather, while high temperatures with no rainfall suggest drought conditions.
Frequently Asked Questions (FAQs)
- What does NDVI tell me? NDVI helps you understand how green and healthy your plants are. Higher values indicate healthy crops, while lower values may signal poor growth or lack of vegetation.
- Why is my satellite data not showing accurate results? Satellite data may be inaccurate due to factors like cloud cover, low image resolution, or delays in data updates. Additionally, smaller farm areas may result in less specific data.
- How do I know if my crops are under water stress? You can assess water stress using indices like NDWI or DWSI. Low values in these indices indicate that your crops may need more water or are facing drought conditions.
- Why can’t I see data for my farm from other countries? Satellite and weather data are usually specific to a region. FarmCloud focuses on your farm’s location to provide the most accurate data. Data from other countries is not available because weather patterns and soil conditions differ significantly
1. Click on the Menu, then proceed down, and then click on "Weather & Satellite"
2. You will be redirected to another page with a Google Map at the top, beneath that you will view the list of Farm Boundaries created
3. On that specific row with the Farm boundary proceed to the right side just after "Date created" You will see 3 dots on the last column.
4. Click on the 3 dots on the right-hand side of the plant you have added. This opens the Step level where you choose " Delete" or "Edit " where needed.
*In case you click edit you will only be able to edit the name of the Farm Boundary.
*Still not sure? Here's a quick video on how to go about it!
Kindly follow the following steps;
1. You click on your Menu, then proceed to the "Expenses" section and click on it.
2. At the top you select either "General Expenses" or "Element Specific Expenses"
3. Then proceed to the right-hand side on the green button and Click "Add Expenses"
4. Once you have added the expenses move your cursor to the right-hand side under status then click "Approved or Reject Expense " where necessary.
- Here is a guide:
Follow the following steps:
1. Click on the menu
2. Go to the "My products" section and click on "Fertilizer and Agrochemicals"
Select the "Fertilizer" section
- Then click on the "Add Fertilizer" button
- Then populate the details as required they include: "Fertilizer name, Supplier, Quantity, Min Quantity Alert, Total Cost, and Application Method."
- Lastly, click the "Add" button.
(Kindly note if you're adding a fertilizer and it doesn't display from the list contact admin)
*Still not sure? Here's a quick video on how to go about it!
1. Crop health monitoring:
Satellite imagery provides a bird's-eye view of your entire farm, allowing you to spot variations in crop health that might not be visible from the ground.
2. Precision agriculture:
By analyzing satellite data, you can create precise maps of your fields showing variations in soil type, moisture levels, and crop performance.
3. Yield prediction:
Satellite-derived vegetation indices, such as NDVI (Normalized Difference Vegetation Index), correlate strongly with crop biomass and potential yield.
4. Water management:
Satellites can detect soil moisture levels and crop water stress across your entire farm. This information helps optimize irrigation schedules, ensuring water is applied where and when it's most needed
Greenhouses FAQs
Everything you need to know about Synnefa's greenhouse solutions. Can’t find an answer? Please chat with our Friendly team
Discover Synnefa's premium greenhouse solutions tailored for every budget. We offer two distinct categories:
- Long-lasting Metallic Greenhouses that are resistant to environmental factors and termites.
- Cost-effective Wooden Greenhouses, promising quality performance for their duration. Compare our top-notch, budget-friendly greenhouse prices here. and find the perfect fit for your agricultural requirements.
Here is a video to guide you through the price calculator:
For pre site surveys and soil tests we require 24 hours notice in order for us to avail a technician to collect the soil samples. So the earliest we can send someone is on Wednesday due to the holidays
Synnefa has partnered with Financial institutions to offer greenhouse on credit to farmers who are interested. If you may want to know more on how to get this, please contact us on +254203892455
We install our greenhouse products across Kenya, East Africa and West Africa. We do actually have projects we have deployed in Ghana, South Sudan, Uganda, Tanzania and Somaliland and we want to keep constructing greenhouses in more African countries. Please visit our projects tab to learn more about what we have been doing across Africa.
To answer this question, we first need to convert acres to square meters, which is a more common measurement for greenhouses. An acre is approximately 4,047 square meters.
- If we are talking about 1/8 of an acre, that is approximately 506 square meters (4,047 divided by 8).
- For 1 acre, it would be 4,047 square meters.
The standard size of our greenhouse is 8M x 30M which is 240 square meters.
- To fit our standard greenhouses into 1/8 of an acre (~506 square meters), we would typically recommend using 2/3 of the space to allow room for farm equipment and walk paths. So, we would calculate 2/3 of 506, which is approximately 337 square meters. With each greenhouse taking up 240 square meters, we could fit one greenhouse (240 square meters) into this space comfortably, with approximately 97 square meters left for paths and equipment.
- For a full acre (~4,047 square meters), using the same 2/3 ratio, we have approximately 2,698 square meters for greenhouses. Dividing this by 240 square meters (the size of our greenhouse), we find that we can fit approximately 11 greenhouses (it's actually 11.24, but we can't have a fraction of a greenhouse) on this space, with the rest left for paths and equipment.
It's important to remember these are approximations, and the layout and exact dimensions of the land can influence the number of greenhouses you can fit. It's always best to have a professional come out and assess the land to give a more precise estimation.